[CentOS] Zabbix + Grafana 安裝
Zabbix 安裝步驟
安裝環境:CentOS 7
1. 關閉 SELINUX
1 | vim /etc/selinux/config |
2. 安裝 Zabbix 4.0 LTS
1 | rpm -Uvh https://repo.zabbix.com/zabbix/4.0/rhel/7/x86_64/zabbix-release-4.0-1.el7.noarch.rpm |
3. 若沒有安裝 MySQL 或 Maria DB,請按照以下步驟安裝 Maria DB
1 | vim /etc/yum.repos.d/MariaDB.repo |
貼上以下內容(根據需求參考以下網址調整 http://downloads.mariadb.org/mariadb/repositories/ )
1 | # MariaDB 10.3 CentOS repository list - created 2019-05-28 01:56 UTC |
1 | yum install MariaDB-server MariaDB-client |
4. 啟動 MariaDB 並設定開機啟動
1 | systemctl start mariadb |
5. 設定 MariaDB root 密碼
1 | /usr/bin/mysqladmin -u root password 'new-password' |
6. MariaDB 安全性設定
1 | /usr/bin/mysql_secure_installation |
7. 建立 Zabbix 用帳號 & Database
1 | mysql -u root -p |
8. 將 Zabbix 初始 SQL 架構和數據導入 MariaDB
1 | zcat /usr/share/doc/zabbix-server-mysql*/create.sql.gz | mysql -uzabbix -p zabbix |
9. 編輯 zabbix_server.conf
1 | vim /etc/zabbix/zabbix_server.conf |
10. 編輯 zabbix.conf
1 | vim /etc/httpd/conf.d/zabbix.conf |
11. 重開服務並設定開機啟動
1 | systemctl restart zabbix-server zabbix-agent httpd |
12. 打開防火牆
1 | firewall-cmd --permanent --add-port=10050/tcp |
13. 打開 http://server_ip_or_name/zabbix 測試
1 | Default Username: Admin |
Grafana 安裝步驟
1. 安裝 Grafana(https://grafana.com/grafana/download )
1 | wget https://dl.grafana.com/oss/release/grafana-6.2.1-1.x86_64.rpm |
2. 設定開機自動啟動 & 啟動 Grafana
1 | systemctl enable grafana-server |
3. 打開防火牆
1 | firewall-cmd --permanent --add-port=3000/tcp |
4. 打開 http://server_ip_or_name:3000 測試
1 | Default Username: admin |
5. 安裝 Zabbix Plugin
1 | grafana-cli plugins install alexanderzobnin-zabbix-app |
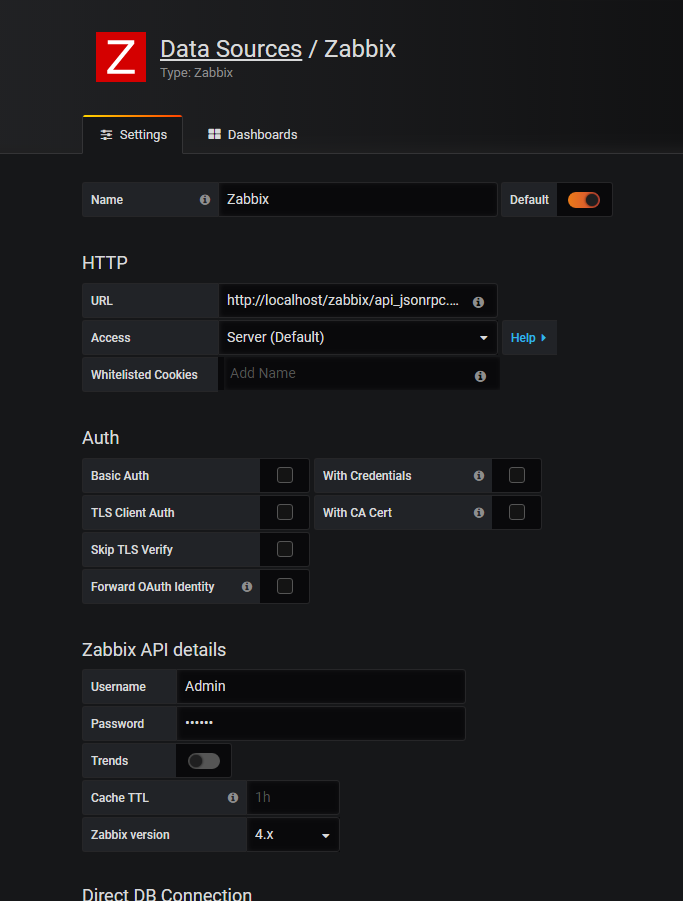
6. 增加 Data source
1 | URL: http://localhost/zabbix/api_jsonrpc.php |
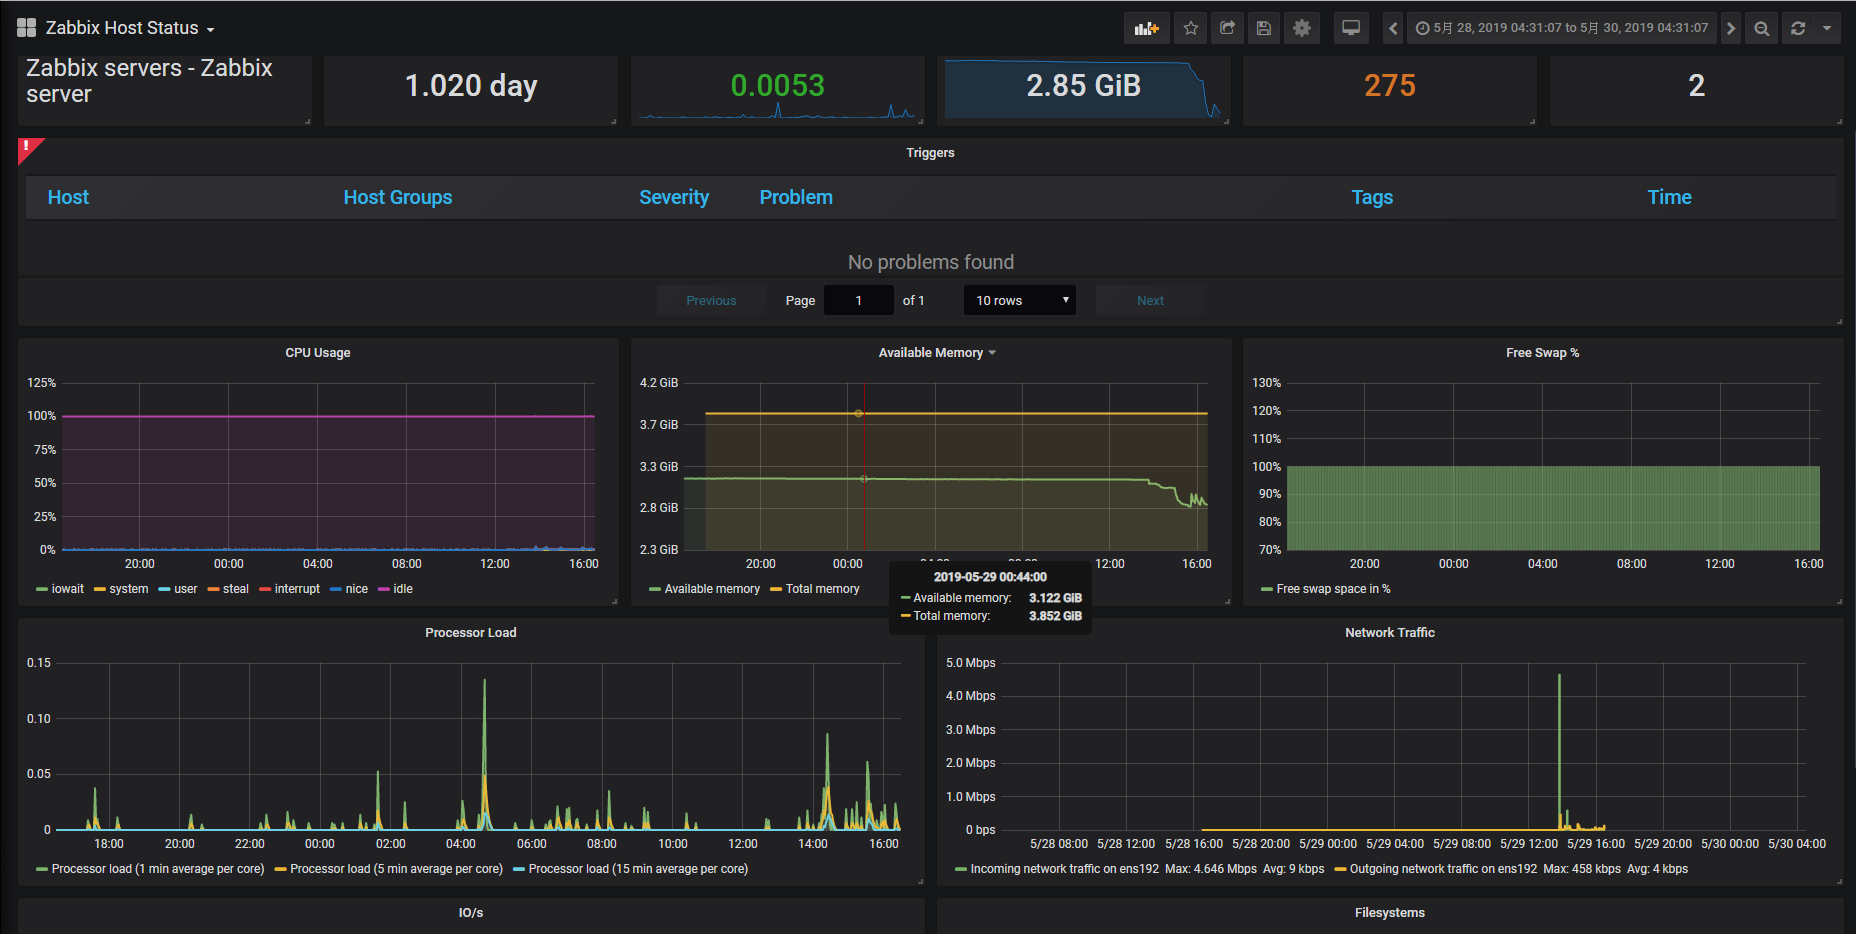
7. 新增 Dashboard 監控設備
可以到這邊找模板 https://grafana.com/dashboards?category=zabbix